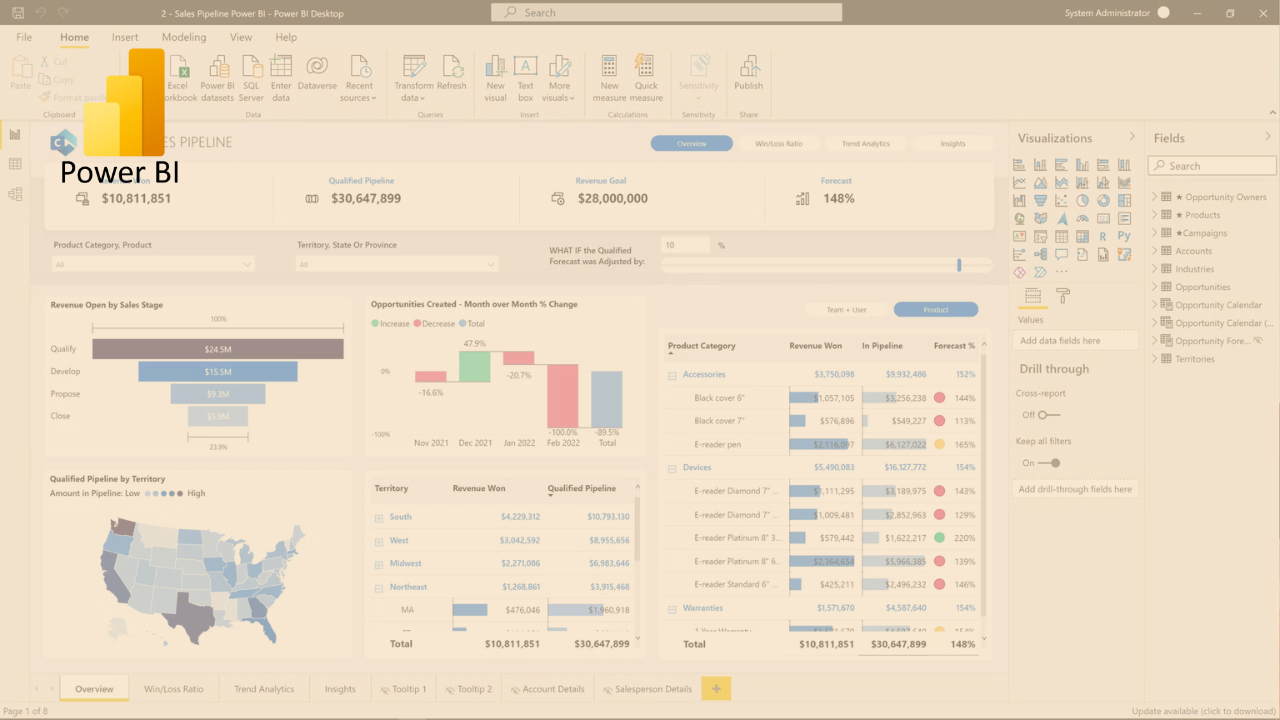
Financial Reporting & Analysis in Power BI
Bestseller
Language: Urdu / Hindi
Language: Urdu / Hindi
ABOUT THE COURSE:
This Power BI course covers essentials and advanced techniques for finance professionals,
including installation, configuration, and interface navigation. You’ll learn data modeling, data
transformations with Power Query, and advanced DAX functions. The course also focuses on
creating effective visualizations, specialized financial reporting, and sharing reports via Power
BI Service. It concludes with financial planning, budgeting, scenario analysis, and integration
with Excel for dynamic modeling.
ABOUT THIS COURSE :
This Power BI course equips finance professionals with advanced skills in data modeling, DAX, financial visualizations, and Excel integration.

This Course Includes:
- 20+ hours on-demand video
- 15 Lectures
- 1 Year access time
- Certificate of completion
- 24/7 WhatsApp Support

This Course Includes:
- 16+ hours on-demand video
- 16 Lectures
- 1 Year access time
- Certificate of completion
- 24/7 WhatsApp Support
Course Content


Module 1: Introduction to Power BI
• Overview of Power BI and its role in financial analysis
• Installing and configuring Power BI Desktop
• Navigating the Power BI interface
• Data import and transformation with Power Query
Module 2: Data Modeling and Relationships
• Importing data from diverse sources
• Establishing data relationships
• Constructing a star schema for financial data
• Data modeling best practices
Module 3: Data Visualization Fundamentals
• Principles of effective data visualization
• Creating fundamental charts (e.g., bar, line, pie) for financial data
• Tailoring visuals for financial reporting
• Leveraging color and formatting effectively
Module 4: Advanced Data Transformations
• Proficient data transformations with Power Query
• Combining and merging queries
• Crafting custom functions
• Utilizing date and time functions effectively
Module 5: DAX (Data Analysis Expressions)
• Introduction to DAX
• Distinction between calculated columns and measures
• Fundamental DAX functions for financial analysis
• Aggregation and filtration of data using DAX
Module 6: Advanced DAX & Time Intelligence
• Advanced DAX functions (e.g., SUMX, AVERAGEX)
• Time intelligence functions for financial reporting
• Crafting financial KPIs and ratios
• Optimization techniques for DAX
Module 7: Data Visualisation Techniques
• Advanced visualizations (e.g., waterfall charts, gauges)
• Drill-through and drill-down capabilities
• Enhancing interactivity with slicers in financial dashboards
• Publishing and sharing reports via Power BI Service
Module 8: Power BI and Financial Planning
• Budgeting and forecasting using Power BI
• Scenario analysis with What-If parameters
• Integration of Power BI with Excel for financial planning
• Constructing dynamic financial models
